GPICD - The GNU PIC
Programmer and In-Circuit Debugger
4. The Graphical User Interface
4.1 Getting Started
To start the GPICD Graphical User Interface, execute the command "gpicd"
from an OS shell or a Window Manager button.
You can give this command a COD file name as an argument, which is the
program you want to debug.
If no argument is specified, no program is loaded, and you will have to
load one with a "Load" button.
4.2 The Main Window
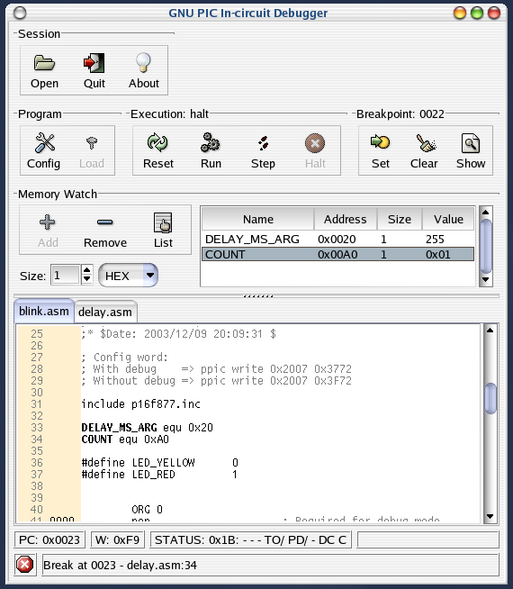
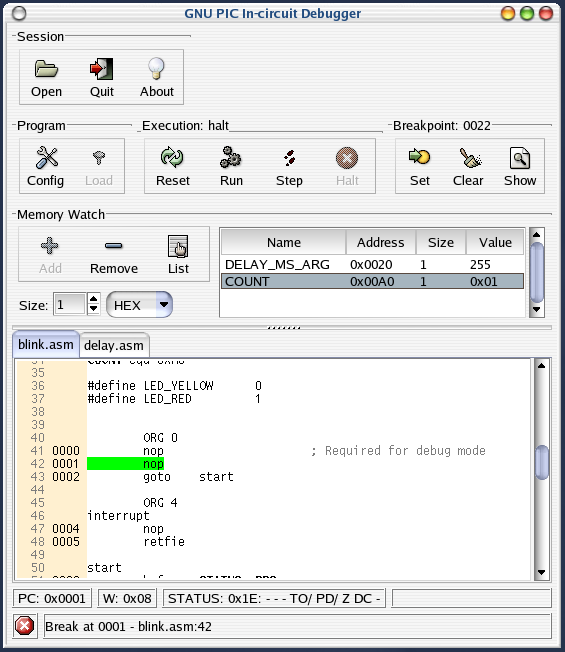
Below is a screenshot of the main window of GPICD graphical user
interface.

The main window is divided into 7 areas providing full control of the
GPICD features:
- The Session area manages the GPICD session:
- The [Open] button opens a COD file for debug;
- The [Quit] button exits the GUI;
- The [About] button shows the current GPICD version and
developper's credits.
- The Program area controls the PIC target:
- The [Config] button raise a window for target
configuration word management;
- The [Load] button start a target program load sequence.
It also automatically loads the ICD monitor if debug is enabled.
- The Execution area controls the target program execution:
- The [Reset] button puts the target in reset state (MCLR
pin to ground);
- The [Run] button starts/resumes program execution;
- The [Step] button resumes program execution for a
single
instruction step.
- The [Halt] button halts the target when it is running.
When the program is halted, registers values are refreshed in the
Memory
Watch area and the Status area.
- The Breakpoint area contains buttons to manage
breakpoints.
- The [Set] button puts a breakpoint at the current
cursor
location in the Source Viewer area. Due to a limitation of the PIC ICD
feature, only one breakpoint can be set at a time.
- The [Clear] button clears the current breakpoint.
- The [Show] buttons shows the current breakpoint in the
Source Viewer area.
- The Memory Watch area allows to maintain a list a
variables to display when the program execution is halted.
- The [Add] button adds in the Memory Watch list a
variable selected in the Source Viewer area.
- The [Remove] button removes a variable selected in the
Memory Watch list.
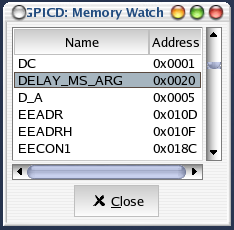
- The [List] button shows a list of all available
variable
symbols. You can select or unselect items from this list to make them
appear/disappear in the Memory Watch list.
- The Source Viewer performs a visualization of program
execution within the source files the target program comes from. The
source files are automatically loaded from the COD file debug
information.
- The Status area displays some useful target information:
- The content of PC, W, STATUS registers;
- The content of a variable currently selected in the source
viewer area;
- The target execution status with some information or error
messages.
4.3 Opening a new COD file
Clicking the [Open] button of the main window raises a file
selection window, which allows to load COD file into the GPICD GUI.
When a new COD file is selected, the associated source files are loaded
into the source viewer and the target is resetted. The new program is
not loaded automatically into the target: you have to do it manually.
If a .cfg file is found beside the .cod file, GPICD assumes it stores
the configuration word settings and load it.
It a .watch file is found, GPICD assumes it stores the memory watch
settings, loads it and update the memory watch are accordingly.
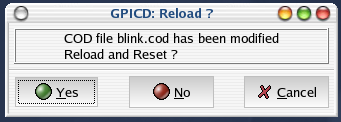
Each time you run the
program, GPICD checks that the COD file has not been updated since
it was loaded. If it the case, a pop-up window asks if you want to
reload the program before running it.

4.4 Target
Configuration management
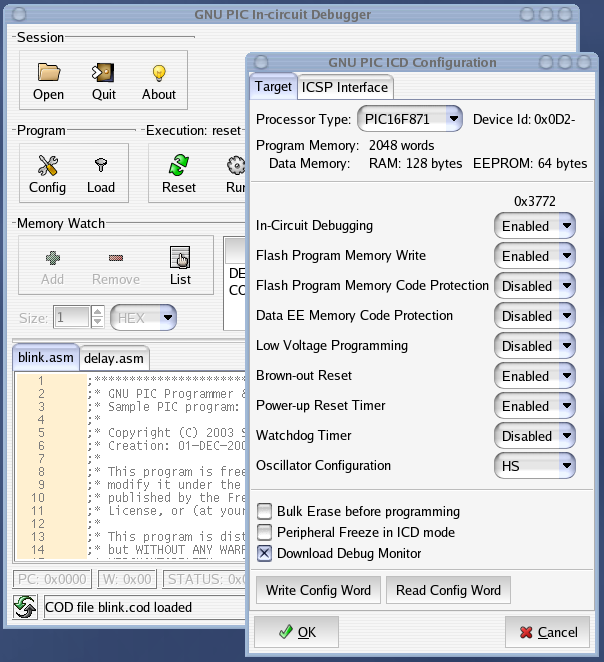
Clicking the [Config] button of the main window raises a
Configuration management window containing two notebooks. The first one
is for editing the target configuration.

This window gives the possibility to choose the processor type, and to
set the various target configuration options for this processor. Please
refer to the Microchip datasheets for a detailed description of the
configuration word.
When a .cod file is
loaded, a .cfg file is
maintained beside it. This
config file stores all the options managed by this window:
- The [OK] button take the changes into account and save
them to the .cfg file.
- The [Write] write the configuration word to the target
processor. This button is activated only if the target is halted or
resetted.
- The [Read] button read the device id and the
configuration
word from the target. If the processor type is recognized in the device
id, it is automatically selected.
- The [Cancel] button close the window without taking the
changes into account.
Two additionnal options are available:
- "Bulk Erase before programming" tells GPICD to perform a bulk
erase of the flash program memory before doanloading the target program.
- "Peripheral Freeze in ICD mode" puts the target in peripheral
freeze mode when debug is enabled. This feature does not affect the
configuration mode: it only manages a flag in an ICD-dedicated
register.
If the target is in halt state, it is automatically updated.
- "Download Debug Monitor" force downloading the ICD monitor each
time the program is loaded. This option can be disabled to improve
programming speed: it is actually useful in the following situations:
- The first time the target is programmed for in-circuit
debugging;
- To refresh the ICD monitor after a flash programming accident.
4.5 Loading a Program into the Target
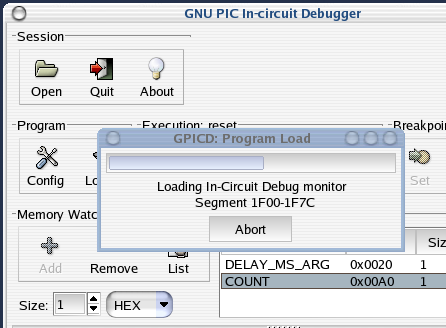
Clicking the [Load] button of the main window starts loading
the
target. The target load performs several operations, which progress is
shown in a small window:

4.6 Managing
Target Program Execution
You can click the [Reset] button anytime: this will reset the
target.
Clicking the [Run] button starts the program. If the debug mode
is enabled, the target always halts after the first instruction. You
can
the continue the program execution by clicking the [Run] or [Step]
button.
When the target is running, you can click the [Halt] button,
which puts the target in halt state. The program counter is then shown
in the source viewer area by selecting the proper source tab and
highlighting in green the next instruction to be executed. All the
debug
operations (watching registers, setting breakpoints, etc.) are possible
when the target is halted. You cannot perform debug operations if the
target is not halted.
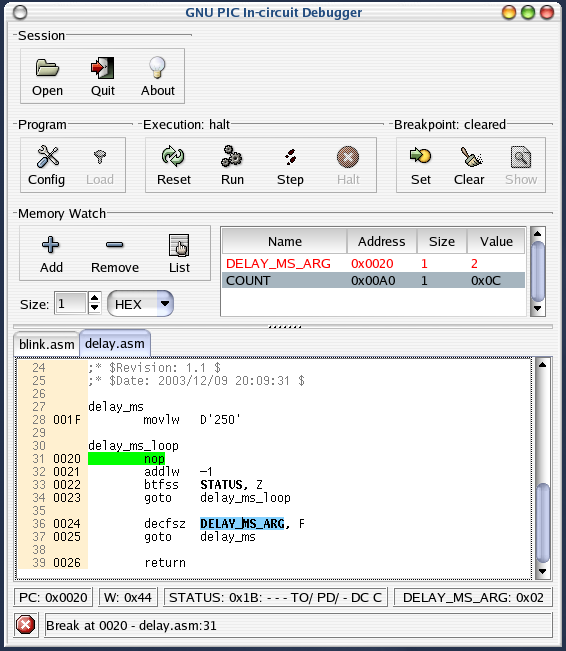
When the target is halted, the memory watch area is
updated and colorizing in red to show the variables which values have
changed since the previous halt.

4.7 Managing Breakpoint
In ICD mode, only one breakpoint can be defined at a time. The target
must halted to
change the breakpoint settings.
Please note that due to the Microchip ICD architecture, when a
breakpoint is encountered during program execution, the target halts
immediately after the instruction pointed to by the
breakpoint.
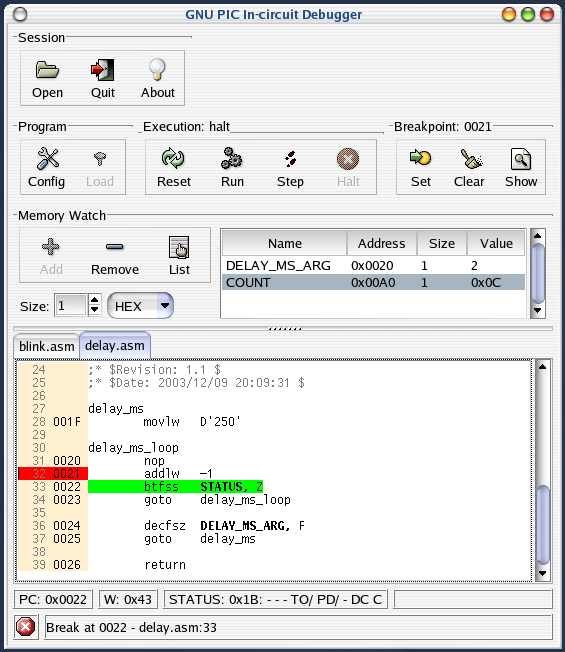
To set a breakpoint, put the cursor of the source viewer area where you
want the breakpoint to be set, and click the [Set] button in
the
breakpoint area. The breakpoint is then marked in red in the left
margin
of the source.
Clicking the [Clear] button clears the current brekpoint.
To find where the current braekpoint is located, click the [Show]
button, and the breakpoint will be shown in the source viewer area.

4.8 Watching
Variables and Registers
When the target is halted, the status bar located below the source
viewer area shows some register values:
- PC: the current program counter;
- W: the W work register;
- STATUS: the status register;
- The currently selected variable.
To select a variable, you simply have to click on its name anywhere in
the source viewer area: it then will be highlighted in blue, and its
content is displayed in the status bar. Only variables declared with
the
EQU assembler statement are selectable: they are shown in bold
characters.

When a variable is selected, you can click the [Add] button of
the memory watch area: the variable will then be added into the memory
watch list.
To delete a variable from the memory watch list, select it in the list
and click the [Remove] button.
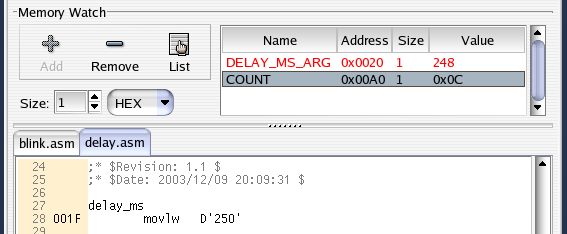
When a variable is selected in the memory watch list, you can also
change its size and its numerical format. Changing the size allows to
show several bytes from the variable base address. Possible formats
are:
binary, octal, decimal, hexadecimal and ASCII.

It is also possible to edit the memory watch list by clicking the [List]
button: the list of all available variables are listed in a dialog
window, in which you can select/unselect items to make them
appear/disappear in the memory watch list:

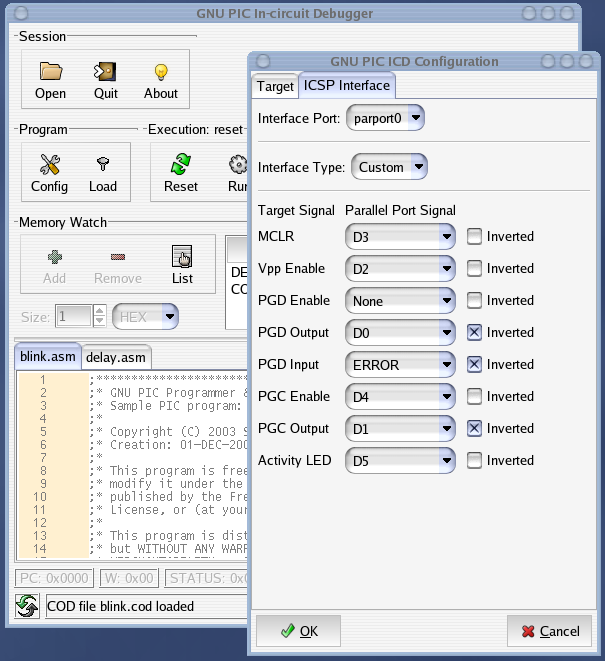
4.9 ICSP Hardware Interface Configuration
Clicking the [Config] button of the main window raises a
Configuration management window containing two notebooks. The second
one
is for editing the ICSP hardware interface configuration.

The various hardware configuration items are described here in the CLI users's manual.
The names of the available parallel port devices are automatically
probed and added in the "Interface Port" menu.
When clicking the [Ok] button, the configuration settings are taken
into account and automatically saved in file .gpicd in
the user's home directory.
http://gpicd.sourceforge.net

Copyright ©
Sylvain
Giroudon 2003
$Revision: 1.9 $
$Date: 2004/12/08 10:04:33 $
